🏠 Home Planning

Rent vs Buy
Calculator

🌐 Web app + 📊 Excel workbook

Explore the numbers behind renting vs. buying — including the break-even year, net worth projection, and what happens if you invest the difference. One purchase gets you both: the web app and the same calculator as an Excel file you keep.

$9.99one-time payment · instant access
Get both versions →

🔒 Secure checkout via Gumroad · Card or PayPal · Instant download

🏠 Rent vs Buy Calculator

Sample result — $460K home, $2,500/mo rent

Tap ƒ to see the formula.

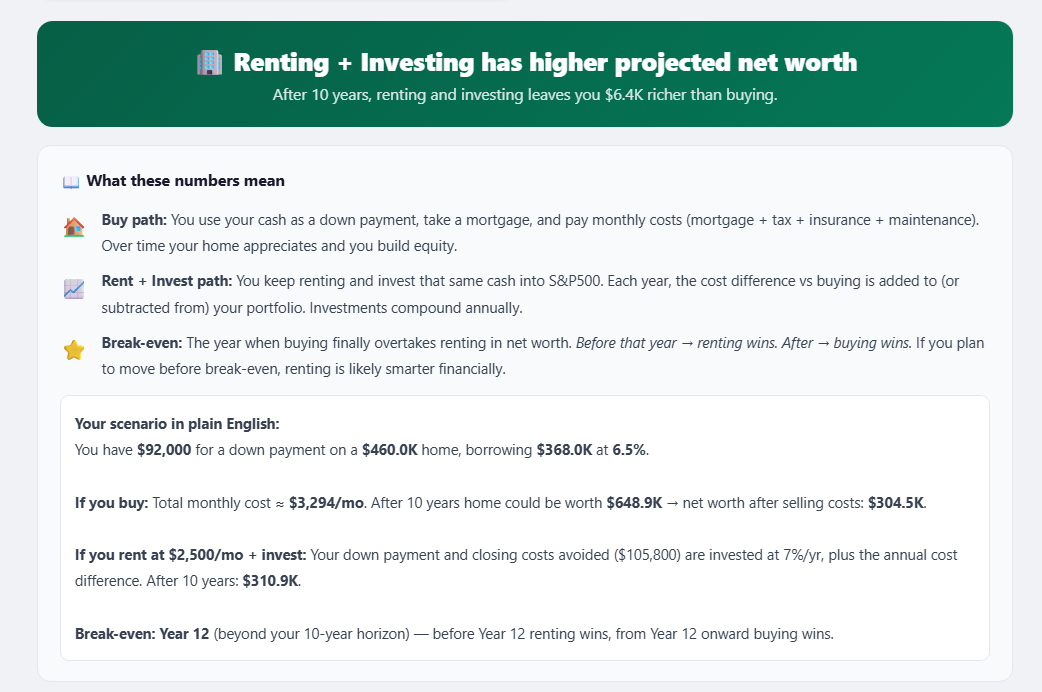
🏢 Renting + Investing has higher projected net worth
After 10 years, renting leaves you $6.4K richer than buying
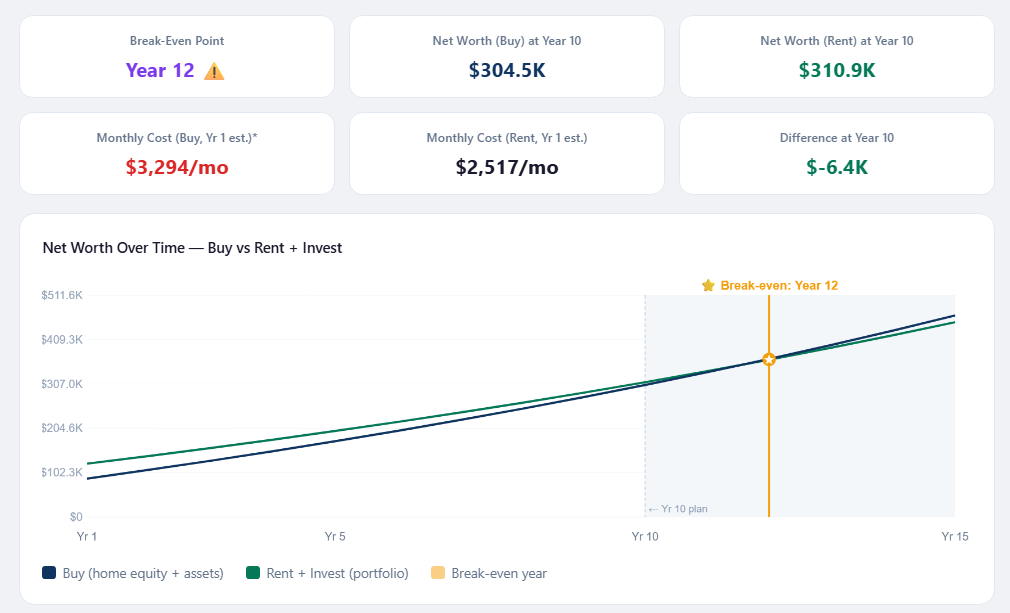
Break-even
Year 12
Net worth (Buy)
$304.5K
Net worth (Rent)
$310.9K
Buy cost/mo
$3,294
Rent cost/mo
$2,517
Difference
-$6.4K

📊Also included: the Excel workbook — the same inputs, these results, charts and a 50-year table, all as live formulas. Change a blue cell and everything recalculates.
Web app preview
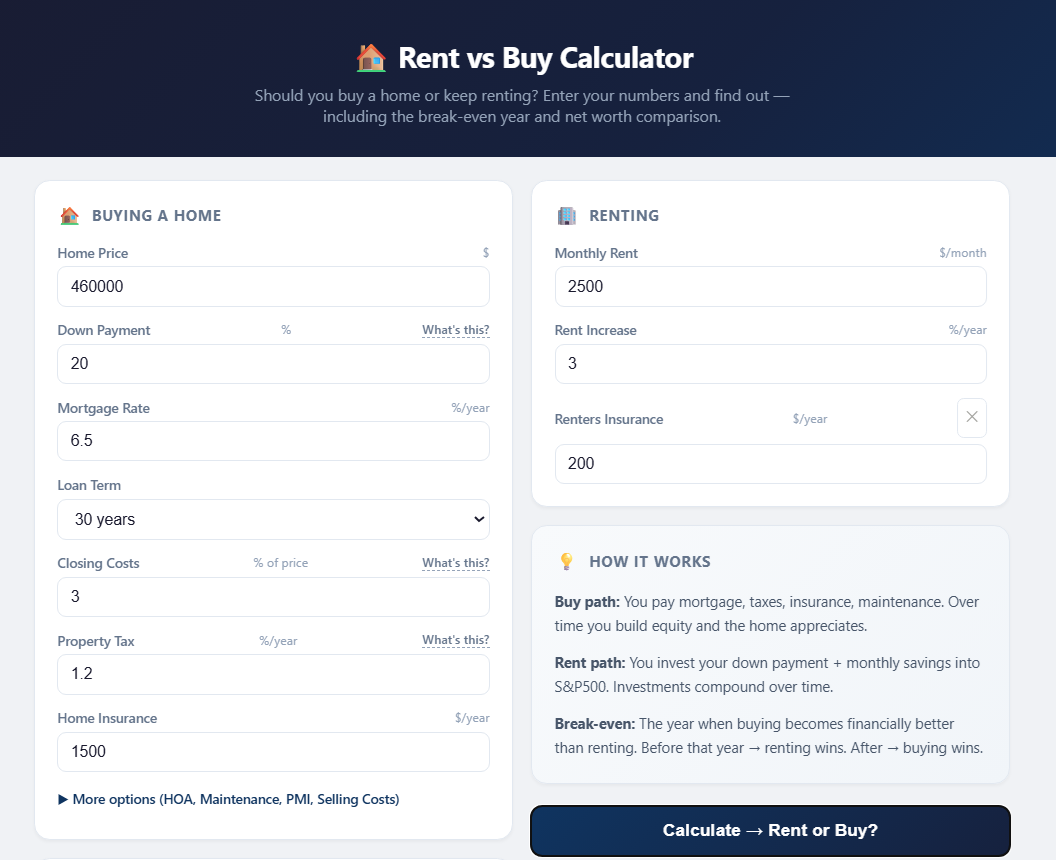
Inputs — buying and renting
Start with your own numbers — home price, down payment, mortgage, taxes, rent and more.
Result with a plain-English summary
$460K home vs $2,500/mo rent: renting + investing has a projected net worth $6.4K higher after 10 years — explained in plain English.
Formula popup for net worth (Buy)
Tap ƒ next to any result to see how it's calculated — net worth (Buy) of $304,456, step by step.
Summary results and net worth chart — break-even Year 12
Break-even lands in Year 12 — two years past the 10-year plan.
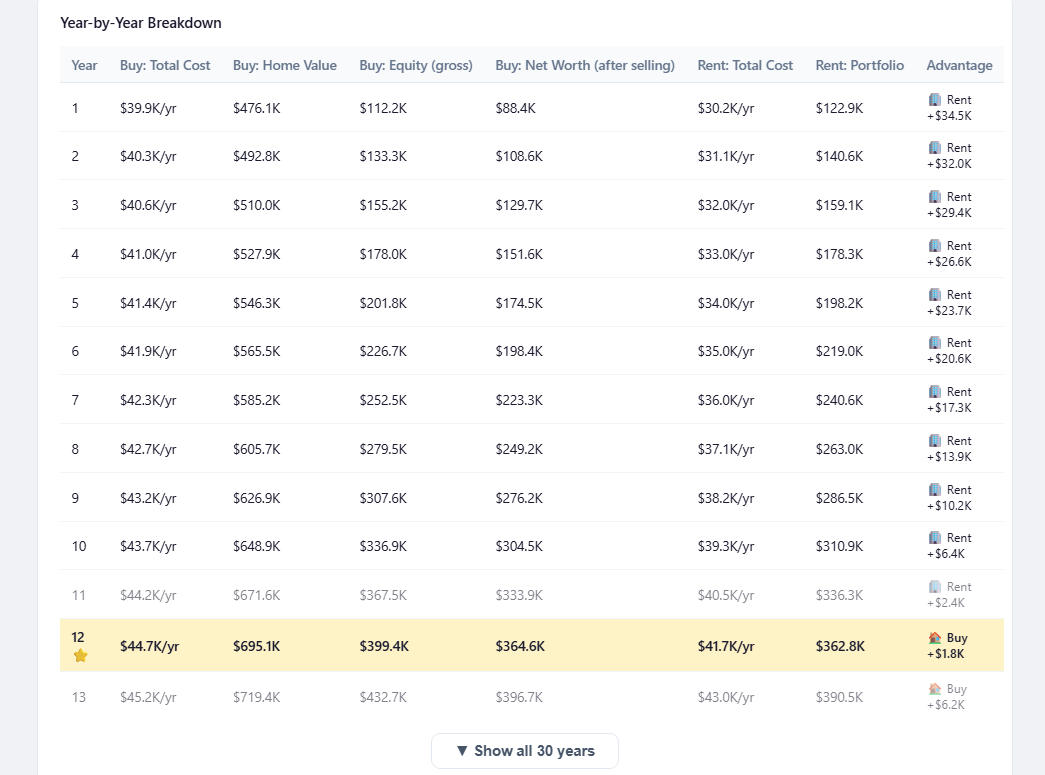
Year-by-year breakdown table
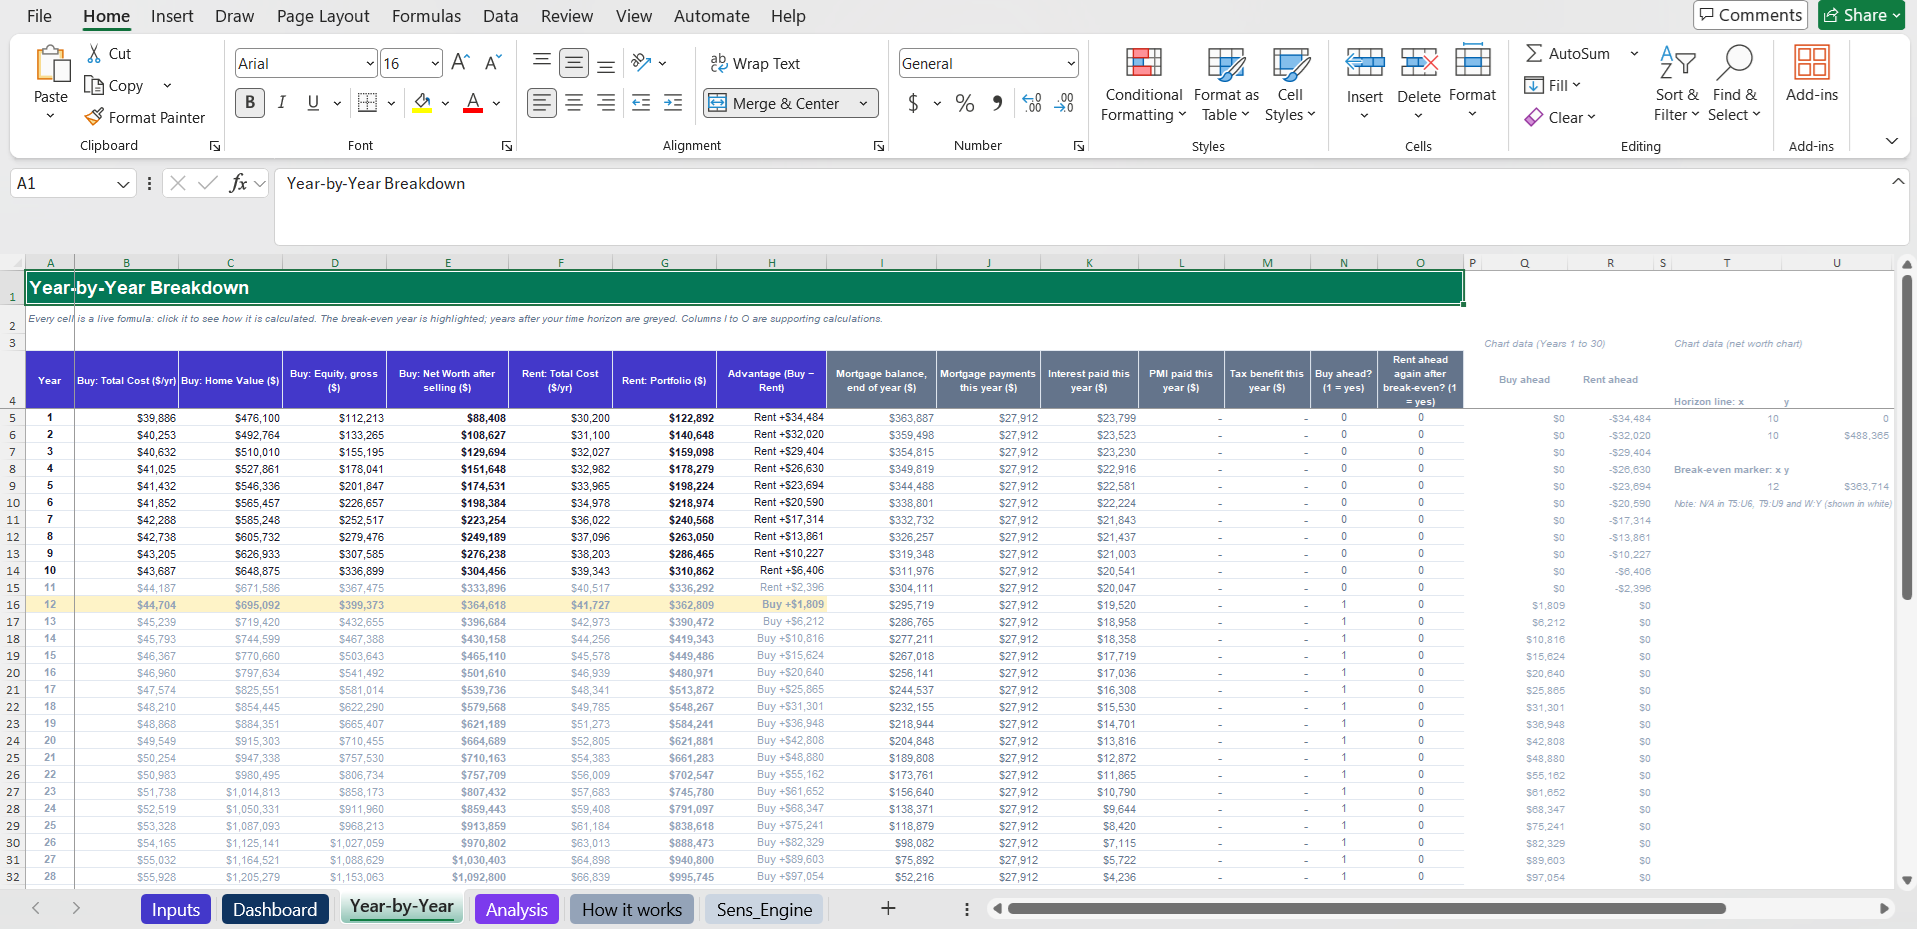
Every year side by side — buying catches up in Year 12. Copy it to Excel or Google Sheets as a live sheet: change any input there and every year updates.
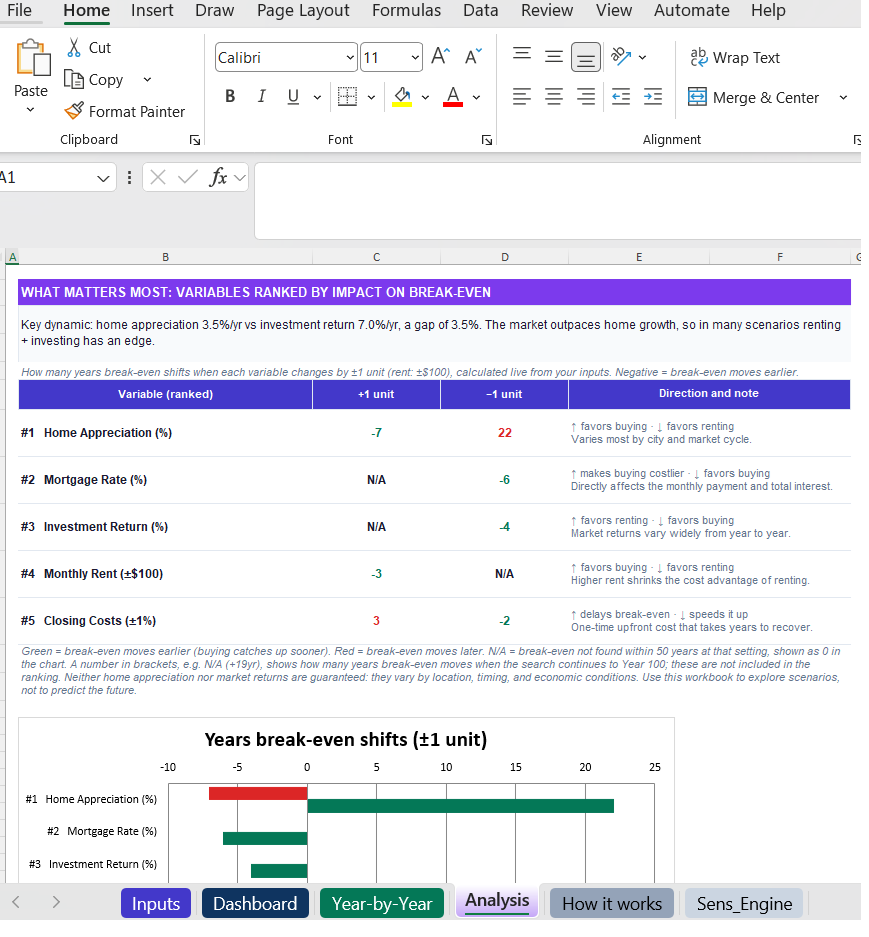
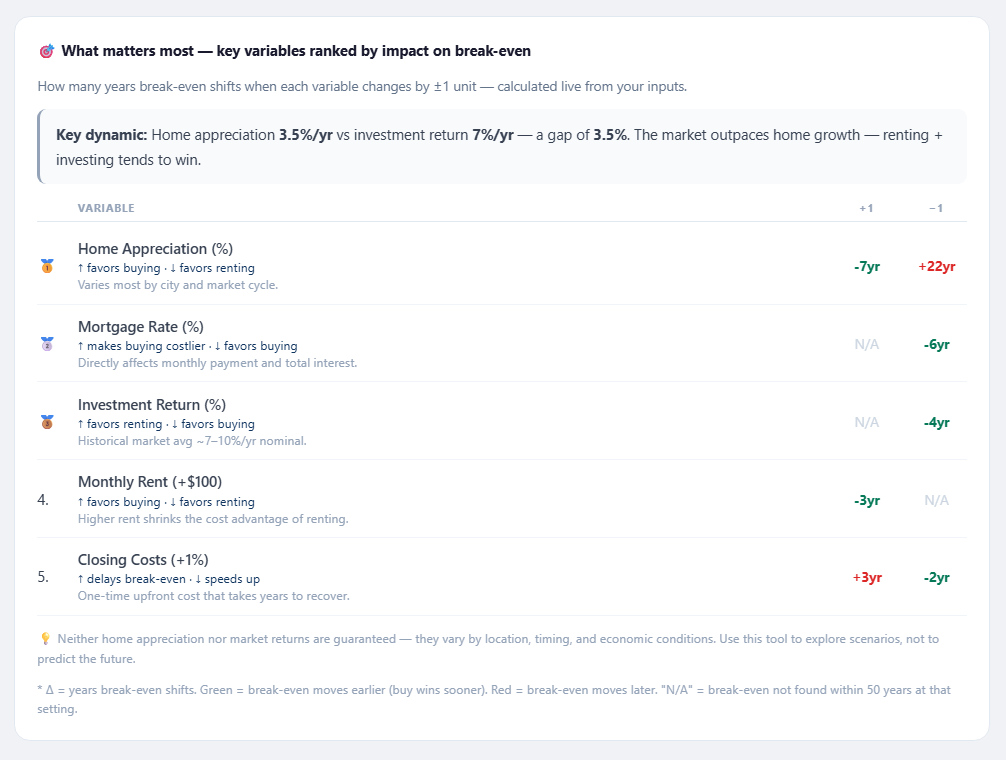
Break-even analysis and key variables ranked
Home appreciation matters most: +1% moves break-even 7 years earlier.
Result at 4.5% appreciation
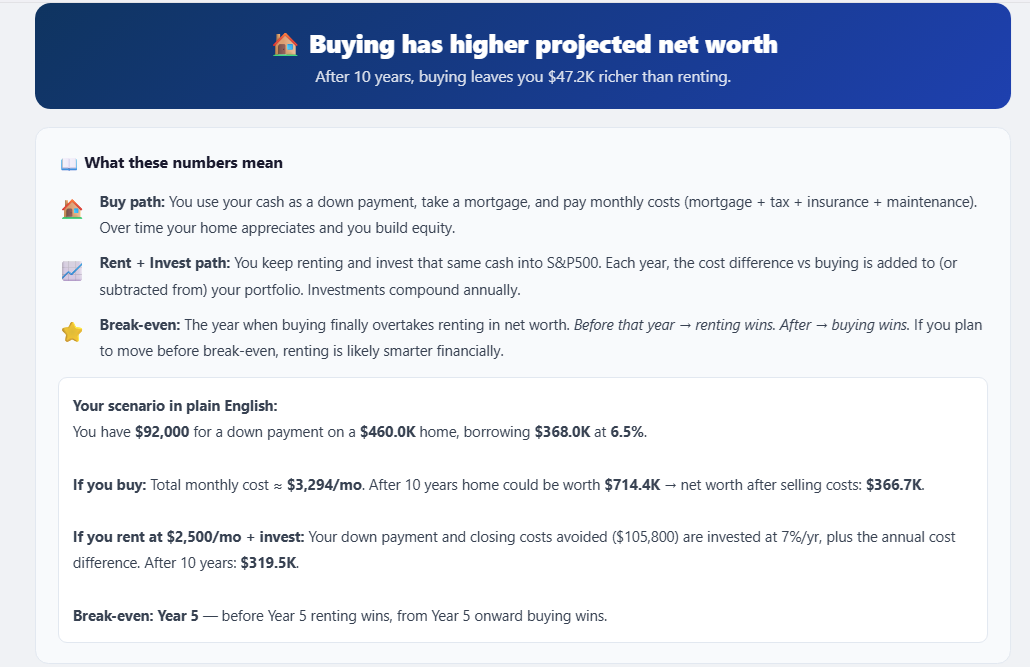
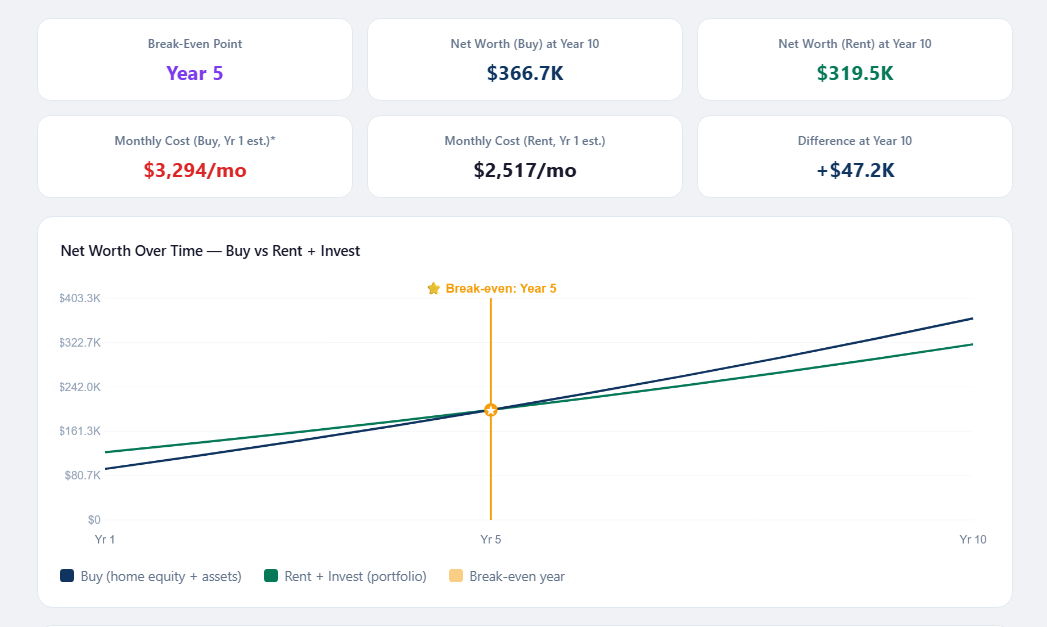
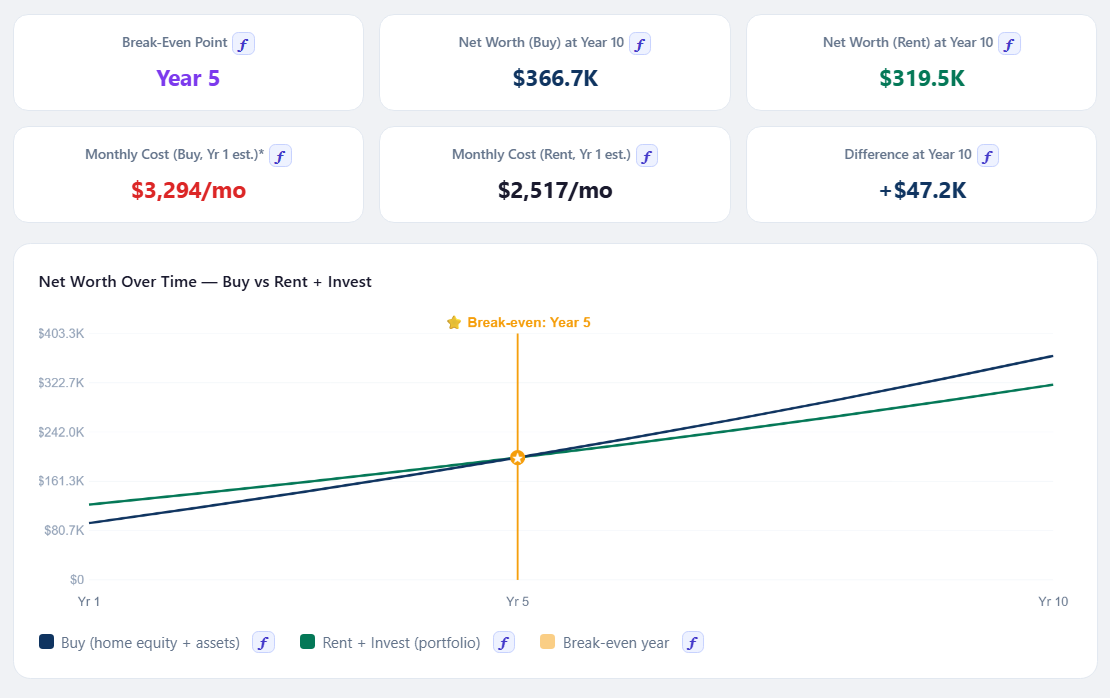
Same home, appreciation 3.5% → 4.5%: buying's projected net worth is now $47.2K higher.
Summary results and net worth chart — break-even Year 5
Break-even moves from Year 12 to Year 5.
Also included · Excel workbook

The same calculator, as an Excel file you keep

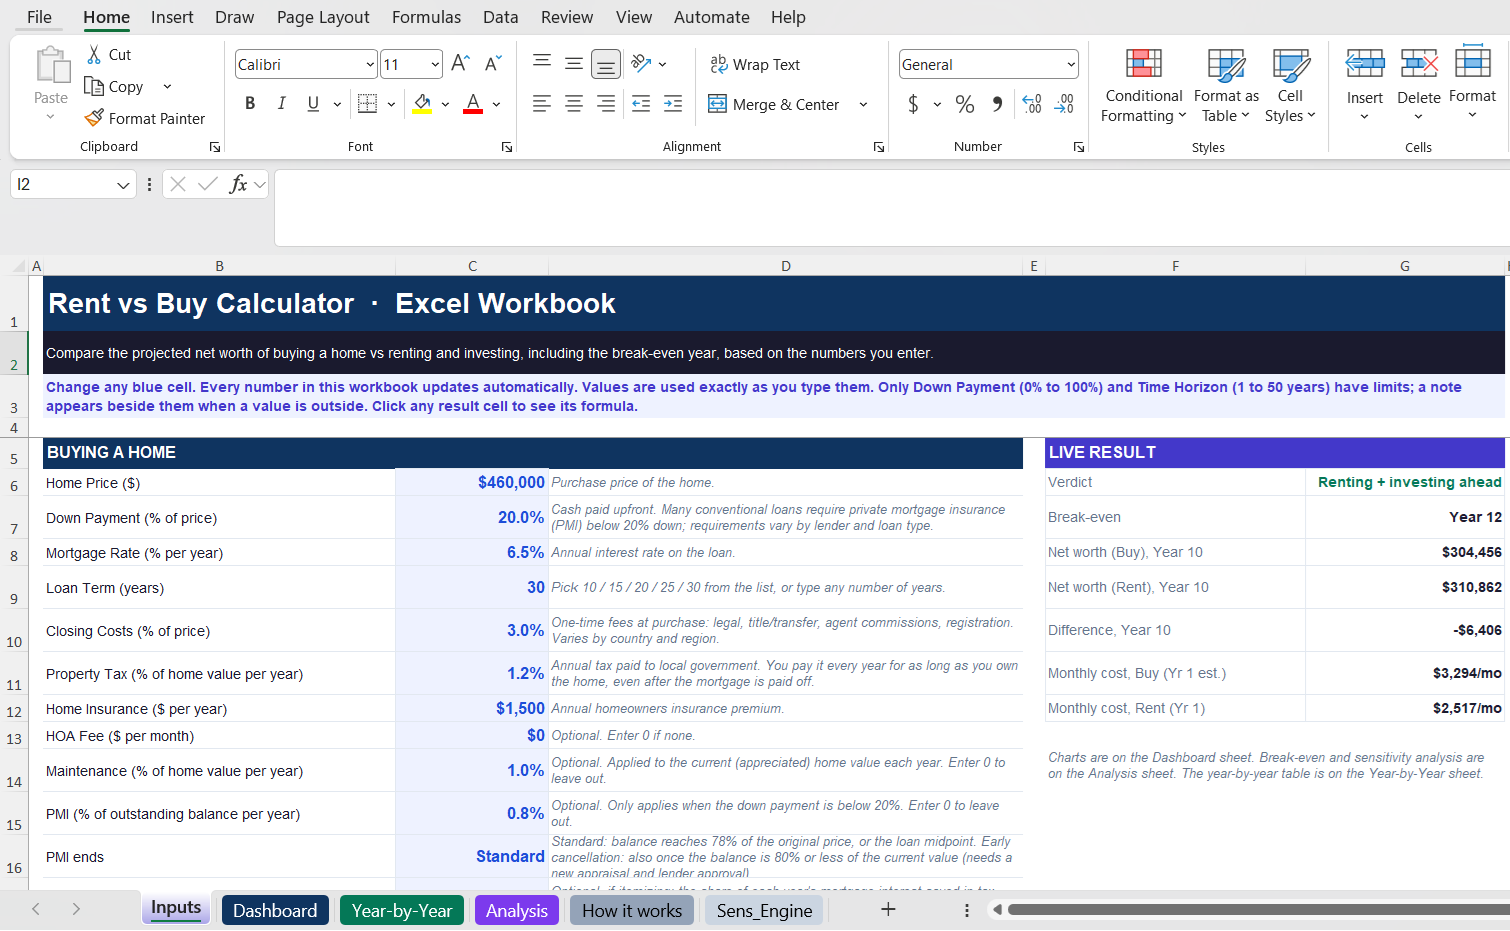
Excel workbook — Inputs sheet with the live result beside the inputs
InputsChange any blue cell — the live result beside it updates right away.
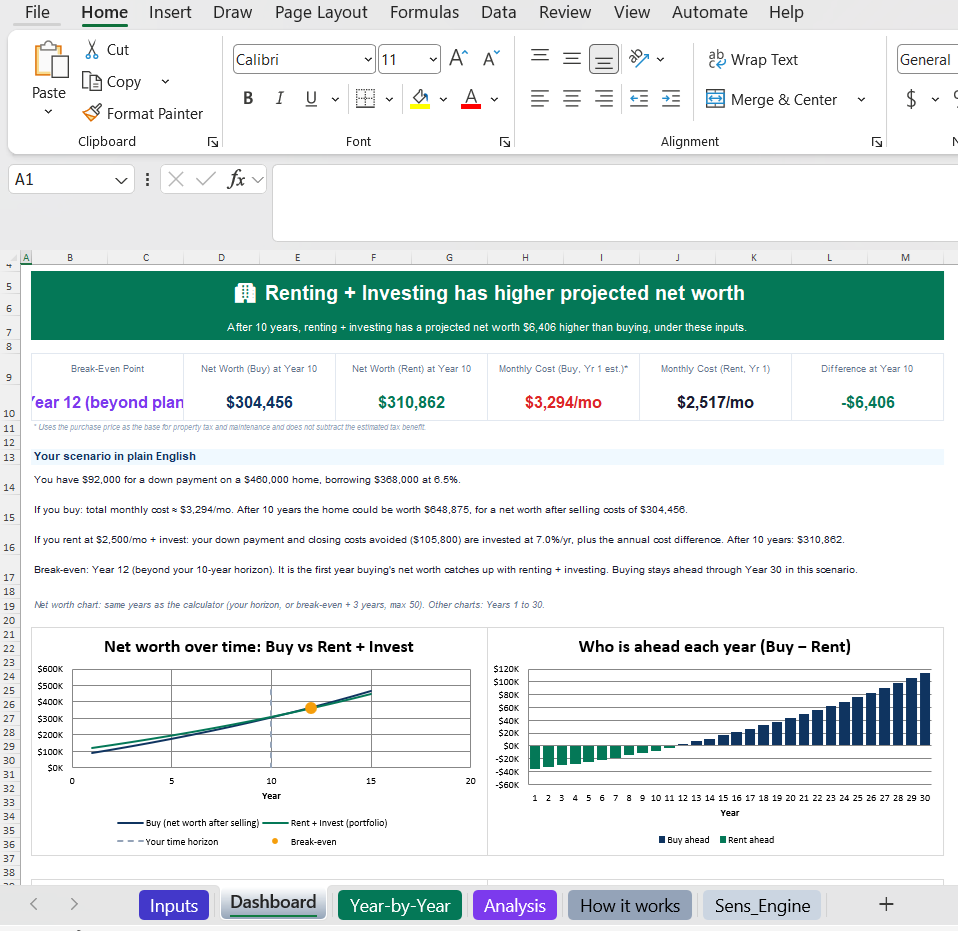
Excel workbook — Dashboard with verdict, key numbers, plain-English summary and charts
DashboardVerdict, key numbers, your scenario in plain English and charts.
Excel workbook — Year-by-Year table, each cell a live formula
Year-by-YearEvery cell is a live formula — click it to see how it's calculated.
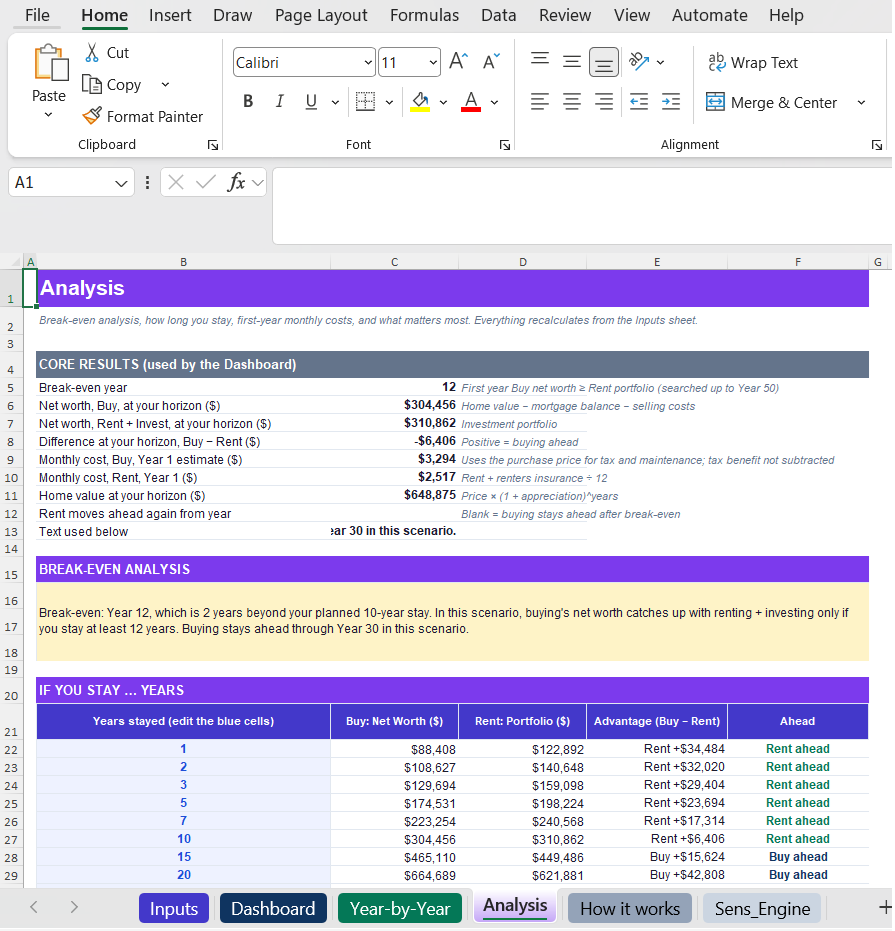
Excel workbook — Analysis sheet with break-even and if-you-stay table
AnalysisBreak-even, and "if you stay … years" side by side.
Excel workbook — variables ranked by impact on break-even, with chart
AnalysisVariables ranked by how much they shift your break-even.

…and more: annual cost, home value vs mortgage and first-year monthly cost charts, plus a built-in "How it works" guide.

Tap a picture to see it full size.

What's inside

Every angle covered

The monthly payment is only one part of the picture. All of this is in both the web app and the Excel workbook.

⭐

Break-even point

See when the projected value of buying overtakes renting and investing the difference.

📈

Net worth chart

Visual comparison of your projected net worth over 15+ years — Buy path vs Rent + Invest path.

📋

Year-by-year table

Home value, equity, portfolio value, and advantage each year — 30 years online, 50 years in Excel.

🎯

Sensitivity analysis

Key variables ranked by how much they shift your break-even — so you know what actually matters.

📝

Plain-English summary

"You have $92K for a down payment... if you rent and invest, after 10 years you'd have $310.9K."

⚙️

Advanced inputs

HOA, PMI, maintenance, selling costs, home appreciation, investment return assumptions.

Inputs

Every input that matters, already laid out

Adjust each input to your own situation — your local home prices, rent, property tax and appreciation — and see how each scenario plays out. The same inputs are already laid out in both versions — nothing to set up.

🏠 Buying inputs

  • Home price & down payment %
  • Mortgage rate & loan term
  • Closing costs (% of price)
  • Property tax & home insurance
  • HOA, maintenance & PMI
  • Home appreciation rate
  • Selling costs when you exit

🏢 Renting inputs

  • Monthly rent & annual increase
  • Renters insurance
  • Investment return (S&P 500)
  • Time horizon
  • Estimated tax benefit (if itemizing)
  • Inflation rate
See the math

Change any value. See how it's calculated.

Both versions start with typical values already filled in — type over any of them, and check how each result is worked out.

🌐 Web app
✏️

Change any pre-filled value

Home price, mortgage rate, rent increase, appreciation, investment return — type over any starting value to match your local market.

ƒ

See the formula

Tap ƒ next to a result, a table column or a chart line to see how it's calculated, step by step.

📋

Copy table with formulas

Paste your inputs, results and the full 30-year table into Excel or Google Sheets — change any input there and everything recalculates.

📊 Excel workbook Also included
✏️

Edit any blue cell

Type any number you like — values are used exactly as you type them. A note appears beside an input only if it's outside a logical limit.

ƒ

Click a cell, see its formula

Every result is a live formula in the formula bar, written with named inputs like HomePrice and InvestReturn so it reads like a sentence.

📖

Nothing locked

Change or extend any formula. The "How it works" sheet explains each column and the assumptions behind it.

Yours to keep

Not a one-time result. Your own calculator.

Buy once and use both versions as often as you like — run every scenario you need.

🌐 Web app
🌐

Use it online

Open your link in any browser and start right away.

📱

Install it, use it offline

Install once on your phone or computer, then use it anywhere — even with no internet.

💾

Save as new file

Keep each scenario separately — a $400K home vs a $500K home, 20% vs 10% down.

Desktop & Android
🔗

Share it

Send a scenario to your partner or advisor.

📊 Excel workbook Also included
📁

A file on your computer

The .xlsx is yours to keep — open it any time, no internet needed.

🗂️

One copy per scenario

Save a copy for each home you're looking at, and compare them side by side.

🧩

Open it in the app you use

Microsoft Excel, Google Sheets or LibreOffice.

🔒 No account, no subscription — your data stays on your device.

Ready to explore your numbers?

Enter your numbers and see your results in a clear, easy-to-understand comparison.

$9.99 · one-time payment
Web appExcel workbook (.xlsx)
Get both versions →

🔒 Secure checkout via Gumroad · Card or PayPal · Instant download

Need more than one? Get all 5 calculators for $39.99 →